3.1 - Complex Numbers
Rendering images of the Mandelbrot set requires the use of complex
numbers. If you are already familiar with them, you can safely skip to
the next section. Otherwise, here is a brief introduction.
You're probably already familiar with the Cartesian coordinate system,
in which a point on the plane can be represented by two numbers x and
y. Complex numbers are just a reorientation of this familiar
concept; we think of each point on the plane being identified with a single
number, called a complex number, that has two components: the
real component, which is the x coordinate, and the
imaginary component, which is the y coordinate. Thus, the
ordinary real numbers that you use every day are identified with the x
axis of the plane.
A complex number with real component a and imaginary component
b is written as follows:
a + bi
The value i is called the imaginary unit, and represents the
point (0, 1) on the complex plane. Complex numbers can be added and
subtracted, just like vectors, simply by adding their components. So,
for instance,
(a + bi) + (c + di) = (a + b) + (c + d)i
Algebraically, i is defined to be the square root of –1.
There is no real number that gives –1 when squared, so this value can
be taken as the basis of all imaginary values. Thinking of i as
a variable no different to any other in algebra, and applying the rule that
i2 = –1, allows us to define multiplication of
two complex numbers. Simply use the ordinary FOIL method for multiplying
binomials that everyone learns in grade school:
(a + bi)(c + di) = ac + adi + bci + bdi2
(a + bi)(c + di) =
(ac - bd) + (ad + bc)i
Division, exponentiation and other arithmetic operations can all be defined
on complex numbers, but we will not need these for this article.
3.2 - Rendering the Set
Now that we have the arithmetic on complex numbers that we will need, we can
proceed to an actual mathematical definition of the Mandelbrot set.
Given any point c on the complex plane, we can define a sequence of
complex numbers z0, z1,
z2, ... according to the following rules:
z0 = 0
zn+1 = zn2 + c
This set of equations, called a recurrence relation, defines a
difference sequence for each possible value of c. The behavior of
this sequence determines whether the point c is part of the Mandelbrot
set. Essentially, there are two possibilities: either the value of
zn will grow without bound (get farther and farther from the
origin) as n increases, or it will remain bounded within some finite
region of the complex plane forever. The values of c for which
the sequence is bounded are the points in the Mandelbrot set.
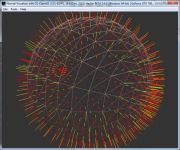
Fig. 2: an unbounded (escaping) sequence.
Fig. 3: a bounded (periodic) sequence.
In Figures 2 and 3 you can see examples of two sequences. In each
case the first white dot is the point c, and the lines show the points
corresponding to the first few values of zn. In
Figure 2, the sequence escapes and becomes unbounded; in Figure 3, the
sequence ricochets back and forth forever between the two points (this is
called a periodic sequence).
Part of what has made the Mandelbrot set so famous and fascinating is the
fact that it is possible to define it using only the elementary operations of
squaring and adding. You might expect that such a complicated and
mysterious object would have to be defined in terms of complicated,
trancendental functions, but this is not the case.
So how do we go about rendering the Mandelbrot set? Clearly, for each
pixel of an image, we must compute the sequence zn and
determine whether it is bounded or unbounded. However, we clearly
cannot compute all of the sequence's infinitely many terms. Therefore,
all Mandelbrot set renderers use the following trick: if one term in the
sequence lands outside the circle of radius 2 about the origin, then the
sequence is guaranteed to be unbounded. (This can be proven using complex
analysis, though we're not going to bother with that in this article.)
Therefore, all we have to do is start computing the terms of the sequence, and
check each one to see if its distance from the origin is greater than 2; if
one does, then the point c from which we started is not in the
Mandelbrot set. If the sequence has not "escaped" after some preset
number of iterations, then c is probably in the set.
In pseudocode, the algorithm for rendering the Mandelbrot set is then:
For each pixel in the image
	Color this pixel black
	Let c = complex number corresponding to this pixel
	Let z = c
	For i = 1 to n_max
		z = z2 + c
		If (Real(z)2 + Imag(z)2 > 4) Then
			Color this pixel according to i
			Break
This method also gives us a convenient way to choose colors for the
image. We could simply use two colors, one for points in the set and one
for points outside it; but this is boring. All the points in the set are
equivalent as far as our algorithm can tell, but the points outside the set
differ in the number of iterations it took for them to escape.
Points far from the set will escape in only a few iterations, while points
very close to the set will require many iterations to escape; thus, we can
create a table that maps the number of iterations to colors, and color the
points outside the set according to this information. There are millions
of possible color schemes, and the same part of the set can look very
different depending on the choice of color scheme. The possibilities are
limited only by your imagination (and by your monitor gamut).
Of course, using the method above we can only compute an
approximation of the true Mandelbrot set. Some points will be
rendered as if they were in the set, when in fact their sequences would have
escaped to infinity after more iterations. This leads to images like
Figure 4, where the set appears too smooth and lacking in detail. By
increasing the maximum number of iterations, we can "chip away" at the
incorrectly smooth parts of the image, revealing hidden detail and rendering
a better approximation of the set. Naturally, the tradeoff is that this
will take more processing time.
Fig. 4: rendering with too few iterations.